Why We Are Likely To Have A Worse Recession Than Investors Now Anticipate
Darius sat down with Julia La Roche last week to discuss inflation, the Fed, and the likelihood of a recession.
If you missed the interview, here are three takeaways from the conversation that have significant implications for your portfolio:
1. A Recession Has A High Probability Of Commencing Over The Next 6-9 Months
Our team has conducted extensive backtests on recession timing after the inversion of the 10-year/3-month treasury yield curve.
We found the 13 – 18 month forward interval has the highest probability of GDP contraction and a rise in the unemployment rate.
The 10-year/3-month yield curve inverted in October 2022, indicating the period between Nov-23 and Apr-24 has the highest probability of the start of a recession.
2. Inflation Will Likely Bottom At A Level Inconsistent With The Fed’s 2% Mandate
Our research suggests Core PCE will likely trend 50% – 100% higher throughout this decade.
In the last decade, the underlying trend of Core PCE YoY was 1.6%. We project that trend will increase to somewhere between 2.5% to 3.1% over the next decade, and prolonged conflict in the Middle East may cause a spike in commodity inflation and push it even higher.
We believe the Fed will need to revise its inflation target upwardly to between 2.5% and 3% to account for the upcoming higher trend.
3. Sticky Inflation Will Force The Fed To Sit On Its Hands
Wall Street survey data shows an increasing number of investors believe the probability of avoiding a recession is high.
We challenge that view. We believe a recession is likely to begin with inflation measures tracking at levels uncomfortably higher than the Fed’s 2% inflation target. That means the Fed will likely be forced to sit on its hands and maintain higher rates until inflation declines.
If that happens, the recession will likely be worse, and asset markets will likely decline further than most investors now expect – after having been dead wrong the US business cycles and asset markets all year.
That’s a wrap!
If you found this blog post helpful:
1. Go to www.42macro.com to unlock actionable, hedge-fund-caliber investment insights.
2. RT this thread and follow @DariusDale42 and @42Macro.
3. Have a great day!
Get Ready For ‘Markets Gone Wild’
Darius sat down with Adam Taggart, founder and CEO of Wealthion, last week to discuss Bitcoin, the stock market, the probability of a recession, and much more.
If you missed the interview, here are three takeaways from the conversation that have significant implications for your portfolio:
1. The US Equity Market Still Has Significant Right Tail Risk Over The Next 3-6 Months
The stock market has historically performed well heading into a recession:
- The median Return of the S&P 500 in the year leading up to the peak around recessions is +16%, with an interquartile range of +14% to +20%.
- More than half of the median return comes in the final three months leading up to the recession.
Our research currently indicates a blow-off top in equities in the months ahead given – especially given the starting point of severely depressed investor sentiment.
2. We Believe The Most Likely Path Forward Is For The Economy to Devolve Into A Mild Recession
Prior to deep recessions, credit typically increases as banks extend credit to less credit-worthy borrowers.
Then, when the economy experiences a tightening of monetary or fiscal policy, the effects are amplified by the large amount of credit present in the financial system.
Today, we have limited credit cycle vulnerabilities, indicated by:
- The Private Sector Credit to GDP ratio of 152%. This ratio has declined throughout this business cycle.
- The Private Sector Credit to GDP ratio trailing five-year z-score of -0.7.
These indicators suggest the recession will likely be moderate because the economy has not experienced the rapid build-up of credit that usually occurs before deep recessions.
3. Bitcoin Will Underperform Stocks Until A Recession Or Sovereign Debt Crisis Forces Central Banks To Pivot
We expect Bitcoin to struggle over the next few quarters until we find a bottom amidst the recession.
If stocks experience a drawdown of 24%, their median drawdown in a recession, Bitcoin will likely fall orders of magnitude further.
Our 42 Macro Global Liquidity Proxy, measured by the aggregated sum of the global central bank balance sheets, global broad money supply, and global FX reserves minus gold, has been trending lower and will likely decline further over the medium term.
Still, we believe Bitcoin will trend significantly higher in the coming years. But we likely will not see a meteoric rise without a recession or significant problem in the sovereign debt markets that causes the stimulus to put Bitcoin on that path.
That’s a wrap!
If you found this blog post helpful:
- Go to www.42macro.com to unlock actionable, hedge-fund-caliber investment insights.
- RT this thread and follow @DariusDale42 and @42Macro.
- Have a great day!
Stocks To Surge & Bonds To Sell Off Before Recession Hits By Early 2024
Darius sat down with Adam Taggart, founder and CEO of Wealthion, last week to discuss inflation, the labor market, the probability of a recession, and much more.
If you missed the interview, here are three takeaways from the conversation that have significant implications for your portfolio:
1. A Resilient US economy Leads to A Resilient Labor Market
The labor market has remained relatively resilient:
- The Private sector employment experienced a three-month annualized growth rate of 2.3% for August.
- Private sector wages are growing at a three-month annualized rate of 3.9%.
- Private sector labor income is growing at a three-month annualized rate of 6.2% and is above its pre-covid trend.
Labor market conditions are likely to remain robust until the spring of next year.
2. “Immaculate Disinflation” Will Give Way To “Sticky Inflation” In The Coming Months
We believe the Immaculate Disinflation that has occurred will likely run out in the coming months. Historically, the US economy has always required a recession to bring inflation back to a below-trend level.
Our HOPE+I framework looks at how unique baskets of indicators representing the housing, orders, production/profits, employment, and inflation cycles have historically behaved around recessions.
The framework shows that inflation typically breaks down 6 – 8 months after a recession starts.
There is no historical evidence to anticipate anything other than inflation exhibiting a similar pattern in this business cycle.
3. The Spread Between Labor Demand And Labor Supply Will Likely Remain Positive For Several Quarters
The most recent US Total Labor Force SA reading was 168 million people – a value below its 2009 to 2019 trendline.
Conversely, Gross Domestic Income recovered its trendline approximately two years ago and remains above it.
Looking at the spread between labor demand and labor supply, we found that labor demand outpaces labor supply by approximately 2.5 million workers.
This spread will likely take a few quarters to return to zero and has sticky implications for workers’ bargaining power for their wages because the spread has historically been correlated to the annual change in the Private Sector Employment Cost Index.
That’s a wrap!
If you found this blog post helpful:
- Go to www.42macro.com to unlock actionable, hedge-fund-caliber investment insights.
- RT this thread and follow @DariusDale42 and @42Macro.
- Have a great day!
What is the Bond Market Signaling?
Darius recently sat down with Ash Bennington on Real Vision’s Daily Briefing to explore the bond market, inflation, FOMC, and more.
If you missed the interview, here are three takeaways from the conversation that have significant implications for your portfolio:
1. The Resilient US Economy Is Likely To Perpetuate The Bear Steepening in The Bond Market
The economy has been and will continue to be resilient for the following ten reasons:
- Near-record cash on household balance sheets
- Near-record cash on corporate balance sheets
- Private sector income and wealth have outpaced inflation throughout this business cycle
- Limited credit cycle vulnerabilities
- Limited exposure to the volatile manufacturing sector
- Longer “long and variable lags”
- A perfect storm for new housing developments
- Bidenomics
- Immigration
- Labor hoarding
We expect the resilient US economy theme will continue for the next three to six months and continue to perpetuate the bear steepening in the bond market.
2. We Challenge The Fed’s New Economic Projections
This week’s FOMC meeting produced a “goldilocks” summary of economic projections:
- The FOMC hiked its 2024 and 2025 median dot 50 bps each.
- The FOMC now sees only two rate cuts in 2024 and seven cuts by the end of 2025, down from four and nine cuts, respectively.
- The FOMC raised its median real GDP estimates by more than double to 2.1% for 2023 and by +40bps to 1.5% for 2024.
- The FOMC lowered its median unemployment rate estimate by -30 bps to 3.8% for 2023, -40bps to 4.1% for 2024-25, and projects unemployment at 4.0% in 2026.
- The FOMC still estimates core PCE will decelerate to 3.7% by year-end, 2.6% by 2024, 2.3% by 2025, and 2.0% by 2026.
With these projections, the Fed implicitly states that we will get more growth and better labor market conditions while still having a soft landing in inflation.
We disagree with the Fed’s view on this, as our research shows that inflation typically breaks down six to eight months into recession.
3. Is 3% the new 2%?
Our secular inflation model indicates that we will have 50-100% more trend Core PCE inflation in this decade relative to the last decade.
We track a basket of indicators correlated with the underlying trend of inflation that indicates the underlying trend is headed to 2.5% in this decade.
Additionally, when you weigh the model on each indicator’s impact, the core PCE trend goes from 1.6% to 3.2%, equating to a 3.5% trend in headline CPI.
Our models indicate that 3% may be the new 2% – both in terms of the trend in inflation and the Fed’s likely-to-be-revised inflation target.
That’s a wrap!
If you found this blog post helpful:
- Go to www.42macro.com to unlock actionable, hedge-fund-caliber investment insights.
- RT this thread and follow @DariusDale42 and @42Macro.
- Have a great day!
A Crude Reality for Stocks?
Darius recently sat down with Maggie Lake to discuss the energy sector, the labor market, the resiliency of the U.S. economy, and more.
If you missed the interview, here are three takeaways from the conversation that have significant implications for your portfolio:
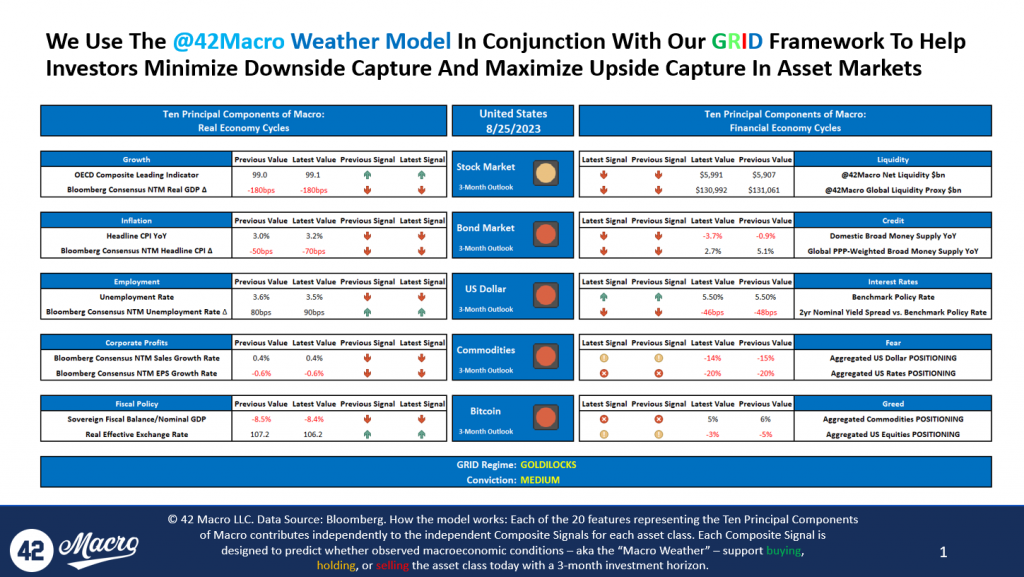
1. The 42 Macro Weather Model Suggests Investors Should Be Operating With Average-to-Below Average Position Sizes Across All Asset Classes Except Cash
Our 42 Macro Weather Model projects the three-month outlook for stocks, bonds, the dollar, commodities, and Bitcoin by analyzing specific indicators within the following ten components of macro:
- Growth
- Inflation
- Unemployment rate
- Corporate profits
- Fiscal Policy
- Global Liquidity
- Credit
- Interest Rates
- Fear
- Greed
Currently, the Weather Model indicates a neutral three-month outlook for stocks and bonds and a bearish three-month outlook for the dollar, commodities, and Bitcoin.
Our daily systematic scoring of key fundamental and technical indicators suggest this is not a great time to be taking a lot of risk in financial markets.
2. The August Jobs Report Will Likely Perpetuate Additional Right-Tail Risk In The US Equity Market Specifically
In the August jobs report:
- Private Sector Employment accelerated to 2.3% on a three-month annualized basis.
- Private Sector Average Hourly Earnings decelerated to 3.9% on a three-month annualized basis, right around the pre-covid trend.
- Private Sector Average Weekly Hours accelerated to 0.0%, the highest reading since March.
- Private Sector Labor Income, the broadest measure of wages and salaries the labor market produces, accelerated to 6.2% on a three-month annualized basis.
In its current “Goldilocks” state, the labor market is too hot to spark further tightening from the Fed but too cold to raise recession fears.
We can persist in this state for several months, which may create additional right-tail risk in the equity market as underperforming professional investors stare down career risk heading into yearend.
3. Near Record Cash on Household Balance Sheets Is Supporting The Resiliency of The US Economy
Our Cash on Household Balance Sheets calculation tracks the Federal Reserve, flow of funds, checkable deposits, and money market fund exposure for both the household and corporate sectors.
The household sector maintains 3% of total assets, or $4.5 trillion, in checkable deposits – approximately $3 trillion more than its pre-COVID values.
The corporate sector checkable deposits also sit around 3% of total assets as well.
Including money market fund exposure, we are currently witnessing the highest levels of cash on the private sector balance sheet as a % of total assets since the 1950s.
That’s a wrap!
If you found this blog post helpful:
- Go to www.42macro.com to unlock actionable, hedge-fund-caliber investment insights.
- RT this thread and follow @42Macro and @42MacroWeather.
- Have a great day!
Odds Are You Suck at Predicting, So Stop
Odds Are You Suck at Predicting, So Stop
Now that we have your attention, let’s spend the next 90 seconds together helping you become a better investor:
- In August 2019, what did you expect to occur in the economy and financial markets in 2020? You would be lying if you said risk assets would suffer their deepest crash since 2008 amid a global pandemic, only to recover sharply because of record fiscal and monetary stimulus.
- In August of 2020, what did you expect to occur in the economy and financial markets in 2021? You would be lying if you said the US economy and risk assets would BOOM due to the combination of vaccine proliferation and record fiscal and monetary stimulus.
- In August of 2021, what did you expect to occur in the economy and financial markets in 2022? You would be lying if you said the Fed would tighten monetary policy at the fastest pace in 40 years amid a 40-year high in inflation.
- In August of 2022, what did you expect to occur in the economy and financial markets in 2023? You would be lying if you said both the US economy and the stock market would prove to be far more resilient than the bond market.
Stop trying to predict everything and join the systematic investing revolution benefitting thousands of 42 Macro clients worldwide. We do as much fundamental research as any firm on global Wall Street regarding what is likely to happen in financial markets, but we do not let those views influence our investment decisions.
The only information that impacts our portfolio recommendations is A) what is actually happening in the economy (not to be confused with what we expect to happen); and B) how what is actually happening has historically influenced asset market performance. The alternative to our systematic, trend-following approach is blowing up your or your clients’ account(s) thinking you can top and bottom tick asset markets with any consistency.
Our Macro Weather Model is the cutting-edge quantitative tool that 42 Macro clients rely upon to nowcast A and backtest B, in real-time, on a rolling basis:
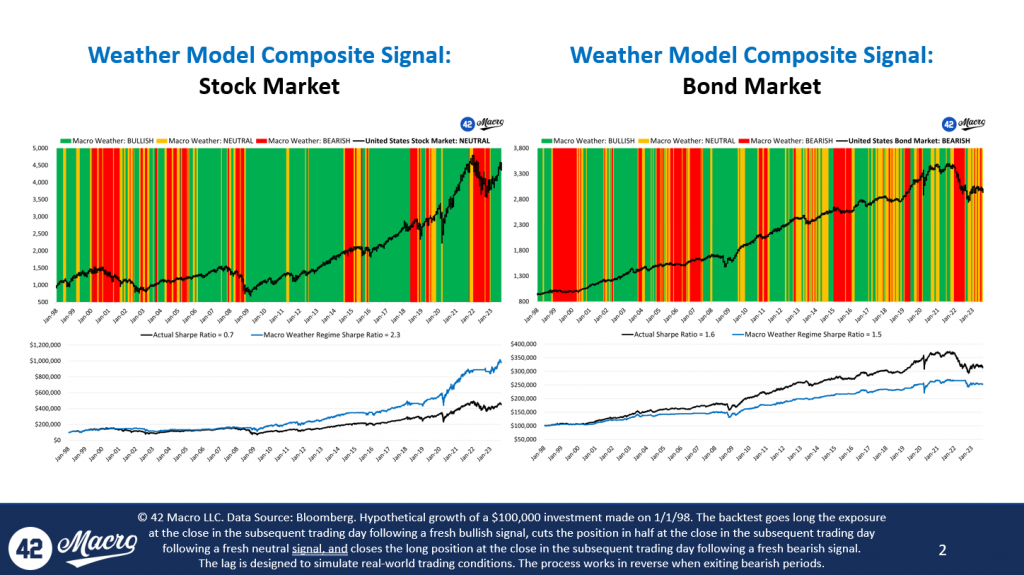
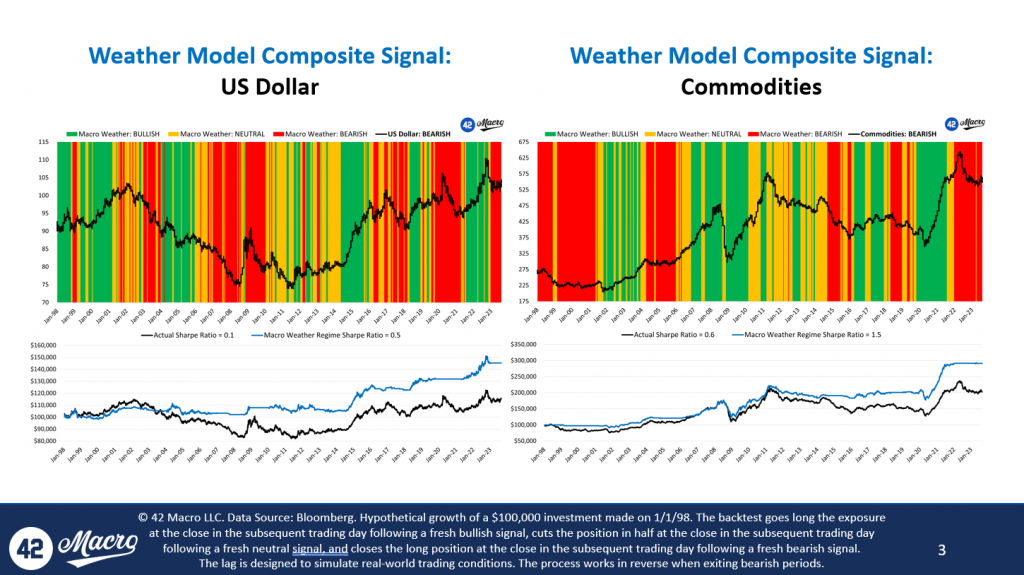
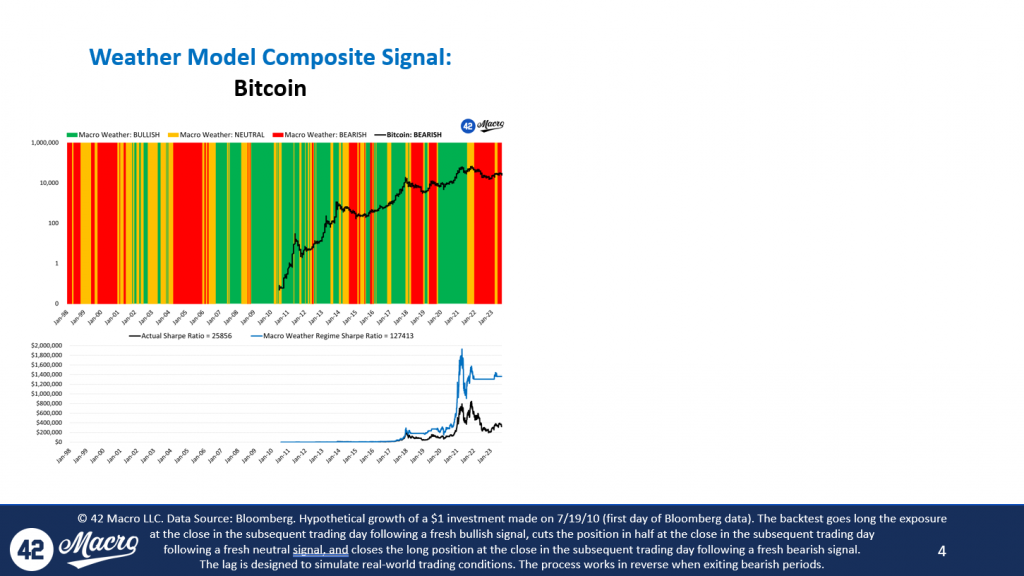
CLICK HERE to download our full Macro Weather Model slide deck for today, August 25th, 2023.
CLICK HERE to see our Macro Weather Model in action across our various research products.
For those of you that now understand the value of adding a Bayesian research and risk management overlay to your investment process, we look forward to helping you improve both your investment performance and investing acumen.For the rest of you, best of luck with your 2024 predictions! We genuinely hope they aren’t as off target as your Aug-19, Aug-20, Aug-21, and Aug-22 predictions likely were about 2020, 2021, 2022, and 2023. Have a great day!
Turbulent Markets Ahead?
Last week, Darius sat down with Paul Barron to discuss global bond markets, #inflation, #bitcoin, and more.
If you missed the interview, we have you covered. Here are three takeaways from the conversation that every investor needs to see:
1. Volatility Has Returned to Global Bond Markets
Over the past month, there has been a striking shift in bond market volatility:
- The US 10-year yields have increased by 48 basis points
- The UK Gilt 10-year yields have increased by 43 basis points
- The German Bunds have increased by 22 basis points
Incremental confirmation of the economic resiliency in the US and Japan and the resiliency of inflation in the Eurozone and the UK have been the driving factors of this uptick in bond market volatility.
2. The Resiliency of The US Economy Will Likely Cause Inflation to Persist
Since last fall, inflation has declined in an “immaculate” way; historically, inflation has only broken down two to three quarters after recessions begin.
But the US economy is not in recession – in fact, it is booming in some respects. The latest estimate for Q3 GDP per the Atlanta Fed’s GDPNow model is a whopping 5.8%.
The strong US economy will likely cause inflation to stabilize at levels higher than the Fed’s price stability mandate.
Within the next 3-6 months, we expect the narrative to pivot from ‘immaculate disinflation’ to ‘sticky inflation.’
3. The Path to Bitcoin’s Next Bull Market Will Likely Remain Volatile
Historically, Bitcoin experiences several 20 to 40% corrections in the years leading up to halvings. We experienced an 18% correction over the past ~month – something we have warned our audience about since April.
We foresee two major tailwinds for Bitcoin in the next year:
- The Bitcoin ETF will eventually get approved, bringing institutional interest with it.
- After the recession begins, which will likely occur in the first half of next year, we anticipate a surge in global liquidity.
We believe these two tailwinds will push Bitcoin north of $100,000 by December 2024, but the path to get there will continue to be rocky and likely back-end loaded.
That’s a wrap!
If you found this blog post helpful:
- Go to www.42macro.com to unlock actionable, hedge-fund caliber investment insights.
- RT this thread and follow @42Macro and @42MacroWeather.
- Have a great day!
Asset Markets And Global Liquidity
Earlier this week, Darius sat down with Anthony Pompliano to discuss all things global liquidity.
If you missed the interview, we have you covered. Here are three takeaways from the conversation that have significant implications for your portfolio:
1. Private Sector Liquidity Is Driven By Currency Volatility And Interest Rate Volatility
There are two key drivers of private sector global liquidity:
We track the US dollar and FX volatility via the USD REER and CVIX, respectively. Both of these measurements are inversely correlated to global liquidity.
Interest Rate Volatility is also a driver, where global liquidity usually lags behind movements in interest rates. Additionally, global liquidity typically follows bond market volatility, as measured by the MOVE Index.
Much of global liquidity comes from the private sector. Generally, net international investment creditor economies like Europe, China, and Japan supply a large amount of liquidity from the private sector.
But risk aversion among those entities weighs on global liquidity in times of interest rate and currency volatility.
2. Global Liquidity Typically Lags Cyclical Movements In Growth And Inflation
Whereas currency volatility and interest rate volatility typically drive private sector liquidity, cyclical upturns and downturns in growth tend to drive public sector liquidity – meaningful slowdowns in growth generally result in increases in public sector liquidity and vice versa.
Inflation also plays a key role in determining public sector liquidity trends, where meaningful cyclical upturns in inflation usually result in a decline in global liquidity and vice versa.
So, from a public sector perspective, central banks generally increase liquidity after slowdowns in both growth and inflation and remove liquidity after observing the opposite conditions.
3. Yes, The Liquidity Cycle Bottomed Last Fall, But Recovery Is Not Linear
Our 42 Macro Global Liquidity Proxy, the $ sum of global central bank balance sheets, global broad money supply, and global FX reserves minus gold, shows that we are in a liquidity cycle upturn and that October 2022 marked the bottom.
However, since April – when we explicitly told investors to book gains at ~$30k Bitcoin – we have been preaching that recovery is not linear like it usually has been in previous cycles. The global liquidity impulse has been negative ever since.
In recent months, the 3-month momentum impulse of global liquidity, we saw a $4 trillion decline in global liquidity in June and a $2.4 trillion decline in July.
Although those readings do not indicate an environment beneficial for asset markets, they are improving at the margins.
All told, 2023 is a great reminder of something we have been preaching all year: liquidity is not the only driver of asset markets. Look no further than the divergence between Bitcoin and the S&P 500 over the past few months to understand this very important point.
That’s a wrap!
If you found this blog post helpful:
- Go to www.42macro.com to unlock actionable, hedge-fund caliber investment insights.
- RT this thread and follow @42Macro and @42MacroWeather.
- Have a great day!
Macro Pro to Pro Live: Kris Sidial Recap
Earlier this week, Darius sat down with Kris Sidial from the Ambrus Group on 42 Macro’s Pro to Pro Live show to discuss reducing the cost of tail risk hedging strategies, investor positioning, #recession, and more.
Here are three takeaways from the conversation that have significant implications for your portfolio:
1) If The Economy Does Not Enter Recession In The Next Quarter, US Corporations Will Be Underinvested And Understocked For A Soft-Landing
Over the past five quarters,
- Investment has declined an average of 29 basis points each quarter, and
- Inventories have declined by 73 basis points each quarter
If consumers continue to spend in line with recent trends (Real PCE on Goods increased 5.4% on a 3-month annualized basis in the most recent report), corporations will need to invest, kicking off a second wave of resilience in the economy.
We believe this second wave of the “Resilient US Economy” narrative will force more underpositioned investors to rotate off the sidelines and into stocks this fall.
2. Although We May See A Short Term Correction, Investor Positioning Implies More Right-Tail Risk In The Equity Market
The following positioning metrics are at levels consistent with local market tops:
- Cash positioning
- AAII Bulls
- AAII Bulls – Bears
- CBOE SKEW Index
Actual positioning in the futures and options market remains historically depressed.
As such, we believe a short-term correction could be the bear trap that leads to the final blow-off top in Q4 2023 or Q1 2024.
3) The Stock Market Typically Increases Leading Up to Recessions
Equities usually rally in the year leading up to recessions, returning a median of +16%, with an interquartile range of +14% to +20%.
They generate more than half of that return in the final three months leading up to a recession; blow-off tops in these late-cycle environments are the norm.
We expect the stock market will peak between October 1, 2023, and March 31, 2024, and we believe a crash will follow once market participants begin pricing in the Phase 2 Credit Cycle Downturn.
Until then, investors should continue riding the momentum wave higher.
That’s a wrap!
If you found this blog post helpful:
- Go to www.42macro.com to unlock actionable, hedge-fund caliber investment insights.
- RT this thread and follow @42Macro and @42MacroWeather.
- Have a great day!
Fresh Evidence of Transitory GOLDILOCKS in the US Economy
The August University of Michigan Consumer Sentiment was marginally confirming of our “resilient US economy” theme.
Specifically, the Employment Survey – one of our “Fab 5” recession signaling indicators – ticked up to its highest level since Sep-22.
Additionally, the 1yr Forward Expected Change in Financial Situation Index ticked up to its highest level since Jul-21.
The August University of Michigan Consumer Sentiment was marginally confirming of the “immaculate disinflation” narrative as well. Specifically, the NTM and 5-10yr CPI forecast declined to their lowest respective levels since Mar-21 and Sep-22.