Evidence Of A Potential Wage-Price Spiral
The ~150,000 member United Auto Workers (UAW) union has declared “war” on Detroit’s big three auto makers GM $GM, Ford $F, and Stellantis $STLAM IM, threatening a strike by September 15 if the companies fail to acquiesce to demands that include a +46% wage increase and a decline in the work week to 32 hours. If a new collective bargaining agreement cannot be achieved by the deadline, the strike will be joined by Unifor — Canada’s largest labor union with ~315,000 total workers and ~18,000 auto workers.
Stories like this are supportive of our view that the narrative around inflation is likely to shift from “immaculate disinflation” to “sticky inflation” within 3-6 months. We have been keen to call out the elevated probability of a soft landing in the US economy. While a soft landing is not our modal outcome, we believe it is a scenario worth educating you on because a soft landing in the economy is highly likely to result in a soft landing in inflation relative to the Fed’s 2% target — which Powell went out of his way to quadruple down on last Friday at Jackson Hole.
No firm on global Wall Street has had a more accurate view on the resiliency of the US economy than @42Macro has for the past year and, as a result, a better call on bonds. We still see more fixed income volatility in the months ahead because we believe the consensus narrative surrounding inflation is likely to deteriorate before the recession hits.
Odds Are You Suck at Predicting, So Stop
Odds Are You Suck at Predicting, So Stop
Now that we have your attention, let’s spend the next 90 seconds together helping you become a better investor:
- In August 2019, what did you expect to occur in the economy and financial markets in 2020? You would be lying if you said risk assets would suffer their deepest crash since 2008 amid a global pandemic, only to recover sharply because of record fiscal and monetary stimulus.
- In August of 2020, what did you expect to occur in the economy and financial markets in 2021? You would be lying if you said the US economy and risk assets would BOOM due to the combination of vaccine proliferation and record fiscal and monetary stimulus.
- In August of 2021, what did you expect to occur in the economy and financial markets in 2022? You would be lying if you said the Fed would tighten monetary policy at the fastest pace in 40 years amid a 40-year high in inflation.
- In August of 2022, what did you expect to occur in the economy and financial markets in 2023? You would be lying if you said both the US economy and the stock market would prove to be far more resilient than the bond market.
Stop trying to predict everything and join the systematic investing revolution benefitting thousands of 42 Macro clients worldwide. We do as much fundamental research as any firm on global Wall Street regarding what is likely to happen in financial markets, but we do not let those views influence our investment decisions.
The only information that impacts our portfolio recommendations is A) what is actually happening in the economy (not to be confused with what we expect to happen); and B) how what is actually happening has historically influenced asset market performance. The alternative to our systematic, trend-following approach is blowing up your or your clients’ account(s) thinking you can top and bottom tick asset markets with any consistency.
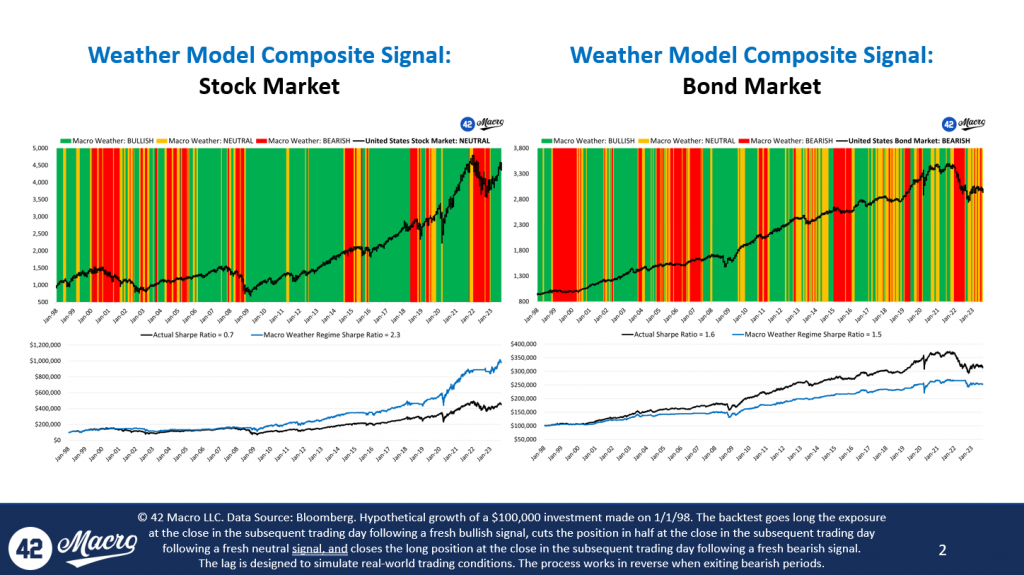
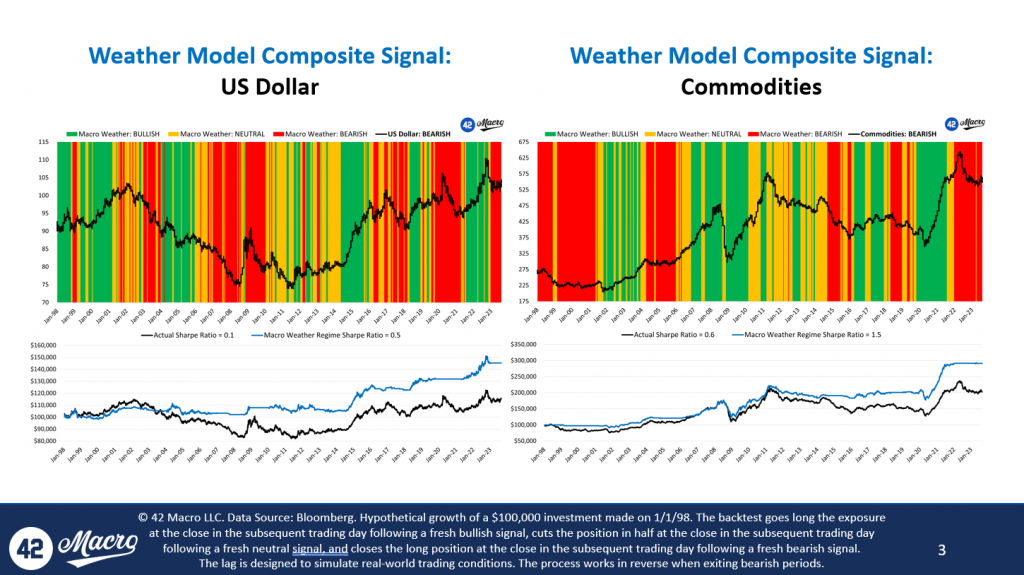
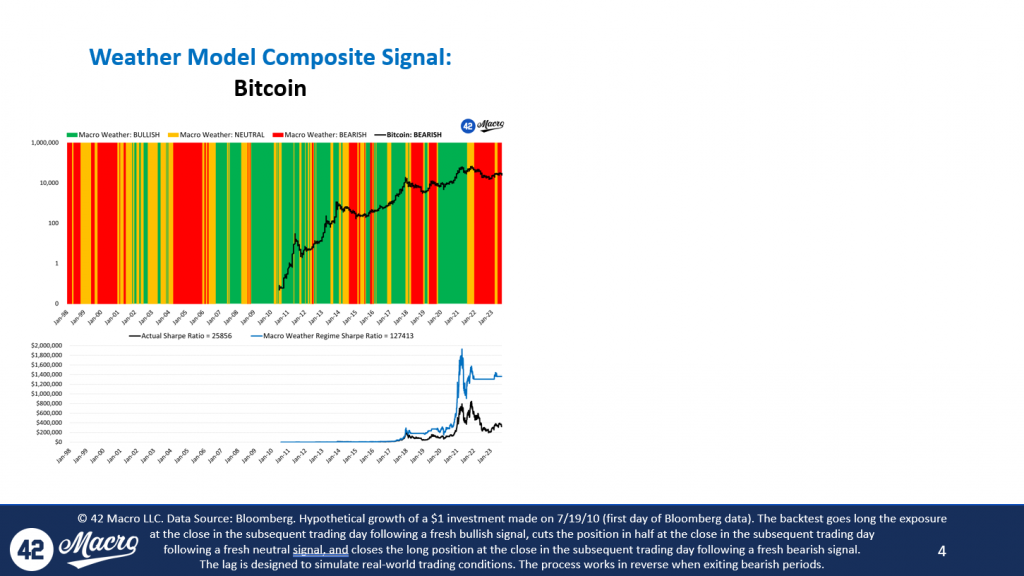
Our Macro Weather Model is the cutting-edge quantitative tool that 42 Macro clients rely upon to nowcast A and backtest B, in real-time, on a rolling basis:
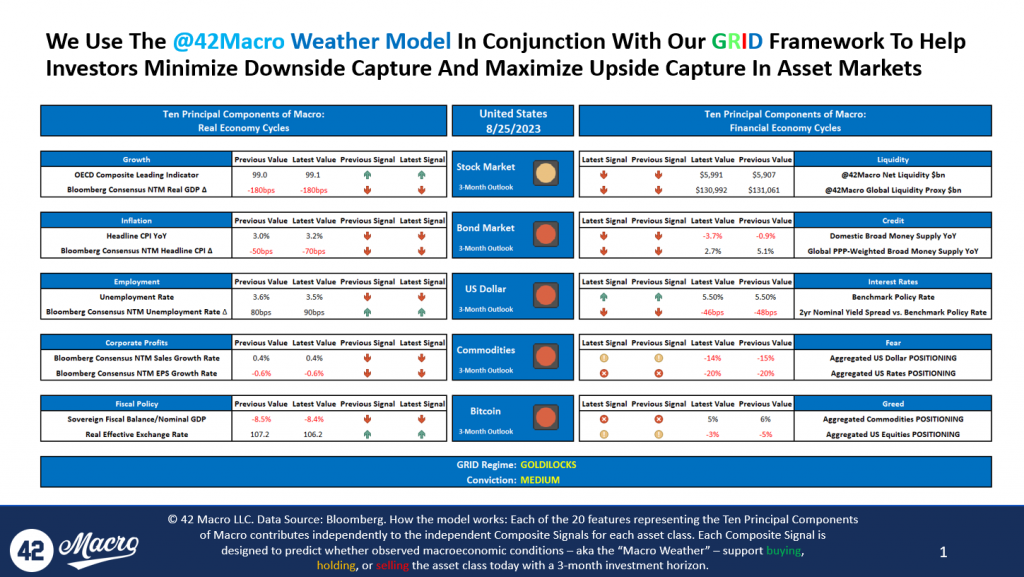
CLICK HERE to download our full Macro Weather Model slide deck for today, August 25th, 2023.
CLICK HERE to see our Macro Weather Model in action across our various research products.
For those of you that now understand the value of adding a Bayesian research and risk management overlay to your investment process, we look forward to helping you improve both your investment performance and investing acumen.For the rest of you, best of luck with your 2024 predictions! We genuinely hope they aren’t as off target as your Aug-19, Aug-20, Aug-21, and Aug-22 predictions likely were about 2020, 2021, 2022, and 2023. Have a great day!
What is Making the U.S. Economy so Resilient?
This week, Darius sat down with Maggie Lake from Real Vision to discuss the resiliency of the US economy, the housing market, and much more.
If you missed the interview, we have you covered. Here are three takeaways from the conversation that have significant implications for your portfolio:
1. The Resiliency of the US Economy Will Likely Continue
Our research shows the US economy has nowcast itself into “GOLDILOCKS” for the past five months. GOLDILOCKS is a regime marked by growth trending higher and inflation trending lower.
The strength of the economy will likely continue because:
- Goods demand is increasing — real goods PCE increased 5.4% on a three-month annualized basis in the most recent month.
- Corporations have been reducing inventories for the past five quarters, reducing 72 basis points off of GDP per quarter, on average. This, paired with increasing demand, could lead to inventory restocking the next few quarters.
2. New Home Sales Are Surging Because The Existing Home Sales Market Has Been Starved of Supply
Today, homeowners are unwilling to sell their homes and trade their ~3.5% mortgage (the effective mortgage rate nationally) for the current market rate of ~7%.
This supply shortage is causing a spike in new home builds:
- Building Permits are growing at 7% on a three-month annualized basis.
- Housing Starts are growing 31% on a three-month annualized rate of change basis.
- New Home Sales are growing at 21% on a three-month annualized basis.
3. “Bidenomics” Is Also Contributing to Our “Resilient US Economy” Theme
The US economy is experiencing a record non-war, non-recession budget deficit under the current administration.
Last year, the deficit was -3.7% of GDP.
Today, it is -8.4%.
That 470 basis point difference equates to approximately $1.3 trillion of incremental fiscal stimulus supplied to the US economy, further contributing to its resiliency.
That’s a wrap!
If you found this blog post helpful:
- Go to www.42macro.com to unlock actionable, hedge-fund caliber investment insights.
- RT this thread and follow @42Macro and @42MacroWeather.
- Have a great day!
Even Higher For Much Longer
Global bond yields hit their highest level since 2008 as investors were forced by the data we have been highlighting to reprice economic resiliency in places like the US and Japan, as well as sticky inflation in places like the Eurozone and UK.
Last week’s Industrial Production (+210bps to a 2mo high 3mo SAAR of -0.9% in July), Capacity Utilization (+70bps to a 2mo high of 79.3% in July), Building Permits (+590bps to a 3mo high 3mo SAAR of 7.1% in July), Housing Starts (+2,560bps to a 2mo high 3mo SAAR of 30.9% in July), and NY Fed Services Activity Survey (+0.6pts to 0.6 in August; highest since Sep-22) were each marginally confirming of our “resilient US economy” theme.
Market participants are increasingly accepting the “higher for longer” guidance we have seen from a handful major central banks — most notably the Federal Reserve.
Floor policy rate expectations (min value on OIS curve out 2yrs) for the ECB, Fed, and BOE have climbed +3bps, +39bps, and +37bps MoM, respectively.
That’s dragged 10yr Nominal German Bund, US Treasury, and UK Gilt Yields up +18bps, +48bps, +37bps, respectively, over that same duration.
The 10yr Nominal JGB Yield — which is effectively managed by the BOJ — is even up +22bps MoM.
China’s Structural Liquidity Trap Rears Its Ugly Head
The economic situation in China continues to be an unmitigated disaster, with the July Retail Sales, Industrial Production, and Fixed Assets Investment all slowing and missing consensus estimates.
Animal spirits in China are being weighed down by beleaguered private sector balance sheets. With respect to liabilities, China remains one of the most indebted major economies in the world. With respect to assets, China’s property market — the #2 asset for Chinese citizens behind bank deposits — has yet to recover from the beating it took from the 1-2 punch of “Zero COVID” and Emperor Xi’s “Three Red Lines” macroprudential policy.
All told, the Chinese economy is doing exactly what we thought it would do in the absence of large-scale fiscal stimulus — i.e., return to the structural liquidity trap it was mired in prior to COVID.
Fresh Evidence of Transitory GOLDILOCKS in the US Economy
The August University of Michigan Consumer Sentiment was marginally confirming of our “resilient US economy” theme.
Specifically, the Employment Survey – one of our “Fab 5” recession signaling indicators – ticked up to its highest level since Sep-22.
Additionally, the 1yr Forward Expected Change in Financial Situation Index ticked up to its highest level since Jul-21.
The August University of Michigan Consumer Sentiment was marginally confirming of the “immaculate disinflation” narrative as well. Specifically, the NTM and 5-10yr CPI forecast declined to their lowest respective levels since Mar-21 and Sep-22.
Correction or Crash?
One recent data point that gives us confidence we are not at the start of a market crash is the July NFIB Small Business Optimism Survey, which was released yesterday. The report had an undeniable GOLDILOCKS (growth UP; inflation DOWN) vibe to it.
On the growth front:
- the Headline Index rose to the highest since Sep-22
- Capex Plans rose to the highest since Jan-22
- Inventory Accumulation rose to the highest since Oct-22
- Sales Expectations rose to a 5mo high
- Hiring Plans rose to a 2mo high
- Few or No Qualified Applicant for Job Openings rose to the highest since Sep-22
On the inflation front:
- the Higher Prices Index fell to the lowest since Jan-21
- Price Plans Next 3mos fell to a 3mo low
- Compensation Plans fell to the lowest since Apr-21
Still No Recession in Sight
From a recession-signaling perspective, we have been watching three statistics that are updated with each month’s Jobs Report: Continuing Claims/Total Labor Force Ratio, Cyclical Unemployment, and Temporary Employment.
- With respect to the Continuing Claims/Total Labor Force Ratio, the 3mo annualized growth rate for July decelerated to -24.6%, well shy of the median rate observed at the start of recessions throughout the history of the time series.
- With respect to Cyclical Unemployment, the 3mo annualized growth rate for July accelerated to -3.3%, well shy of the median rate observed at the start of recessions throughout the history of the time series.
- With respect to the Temporary Employment, the 3mo annualized growth rate for July decelerated to -6.5%, narrowly shy of the median rate observed at the start of recessions throughout the history of the time series and is the only one of our “Fab 5” Recession Signaling Indicators suggesting the US economy is currently in a recession.
With the Fed nearing the end of its rate-hiking scheme, asset markets likely require a recession for the current correction to develop into a crash.
The Most Important Number In Today’s Jobs Report
The spread between Labor Demand (Household Survey Employment + JOLTS) and Labor Supply (Total Labor Force) rose to 3.7mil in July from 3.6mil in June. This statically rare phenomenon of excess labor demand is the key reason wage growth remains robust amid trending “immaculate disinflation” and improving Nonfarm Productivity (3.7% QoQ SAAR in Q2; highest since 3Q20).
The US Economy Is Very Strong
Yesterday, Darius joined Anthony Pompliano to discuss Consumer Spending, Personal Income, Inflation, and more.
In case you missed it, here are the three most important takeaways from the interview:
1. Consumer Spending Has Accelerated In Recent Months
Consumer spending, the total value of all goods and services purchased by households, makes up 68% of GDP.
Last week’s PCE report indicated that Real Personal Consumption Expenditures accelerated to 2.9% in June, primarily driven by a rebound in goods consumption – a three-month high.
In addition, Real Goods PCE accelerated to 5.4% on a three-month annualized basis, also a three-month high.
Both readings suggest US consumers remain incredibly resilient.
2) Accelerating Income Growth Supports Our “Resilient US Economy” Theme
Even if individual real wages are declining, as we have seen recently, overall consumer income can still grow from increased employment, government support, and other income sources.
Nominal Employee Compensation, the broadest nominal measure of income published about the labor market every month, accelerated to 6.2% three-month annualized in June – the highest reading since September last year.
Additionally, Personal Interest Income, the income individuals receive from interest-bearing assets like savings accounts and bonds, accelerated to 8.8% three-month annualized basis in June.
This figure is the highest number we have seen since January of this year and signals that consumers may have more disposable income to spend.
3) The Inflation Fight Is Improving Significantly
Typically, inflation breaks down AFTER a recession. This year, we have seen the opposite – a term referred to as “immaculate disinflation”.
In Friday’s PCE report:
- Core PCE, the Fed’s preferred measure of inflation, decelerated to 3.3% on a three-month annualized basis, the lowest print since February 2021.
- Super Core PCE decelerated to 3.2% on a three-month annualized basis, the lowest print since July 2022.
- Median PCE decelerated to 3.8% on a three-month annualized basis, the lowest print since August 2021.
- Trim Mean PCE decelerated to 3.4% on a three-month annualized basis, the lowest print since August 2021.
We expect the YoY inflation numbers to follow the low three-month annualized rates over the coming months, strengthening the immaculate disinflation narrative supporting asset markets.
That’s a wrap!
If you found this blog post helpful:
- Go to www.42macro.com to unlock actionable, hedge-fund caliber investment insights.
- RT this thread and follow @42Macro and @42MacroWeather.
- Have a great day!