Buy The Dip Until “Immaculate Disinflation” Transitions To “Sticky Inflation”
A return of inflation pressure destroys the “transitory GOLDILOCKS” narrative and potentially derails the actual GOLDILOCKS US economy that has supported risk assets for the past few quarters, paving the way for a cross-asset crash. Our qualitative research views expect that process to occur within 3-6 months. Our best guess based on the momentum in key inflation time series and the labor market is sometime around yearend or early in the new year.
Emphasis on “guess”. We deliberately never speak in certainties about the future; the only investors that do are those chasing clout on podcasts and social media platforms. Beware conviction from folks that lack the DEEP, DAILY Bayesian inference process required to understand the full distribution of probable economic and financial market outcomes.
If we are wrong on the timing of the handoff from “immaculate disinflation” to “sticky inflation” and it happens much sooner than our 3-6 months [from now] projection, our Global Macro Risk Matrix will transition from risk-on REFLATION to risk-off INFLATION early in that process. Such a shift would be your queue to shift from a buy-the-dip mentality to a sell-the-rip mentality in asset markets. It would also be your queue to pivot defensively from a factor tilt perspective. Until then, we remain constructive on risk in accordance with the “transitory GOLDILOCKS” that we co-authored with our friend Bob Elliott in January.

The US Economy Remains As Resilient As Ever
Last week’s +1.8pt MoM advance in the ISM Services PMI (54.5 = 6mo high) was adequately presaged by the New York Fed’s Services Survey a couple of weeks ago. The New Orders PMI hit a 6mo high as well alongside the highest reading in the Employment PMI since Nov-21.
The probability of a near-term recession continues to dwindle because the services sector accounts for 86% of Total Nonfarm Payrolls.
Offsetting the positivity was the 4mo high in the Prices PMI, which is now trending higher again. If the inflation narrative devolves sooner than our qualitative research views anticipate, we could be in the early innings of a market crash.
China’s Crude Oil Imports accelerated to 30.9% YoY in August, fanning the flames of an ill-timed, hazardous breakout in energy prices.
All eyes on Wednesday’s August CPI report to confirm or disconfirm the prevailing “immaculate disinflation” theme, which itself is one-half of the “transitory GOLDILOCKS” theme we co-authored in mid-January (with the other being “resilient US economy”).
A Crude Reality for Stocks?
Darius recently sat down with Maggie Lake to discuss the energy sector, the labor market, the resiliency of the U.S. economy, and more.
If you missed the interview, here are three takeaways from the conversation that have significant implications for your portfolio:
1. The 42 Macro Weather Model Suggests Investors Should Be Operating With Average-to-Below Average Position Sizes Across All Asset Classes Except Cash
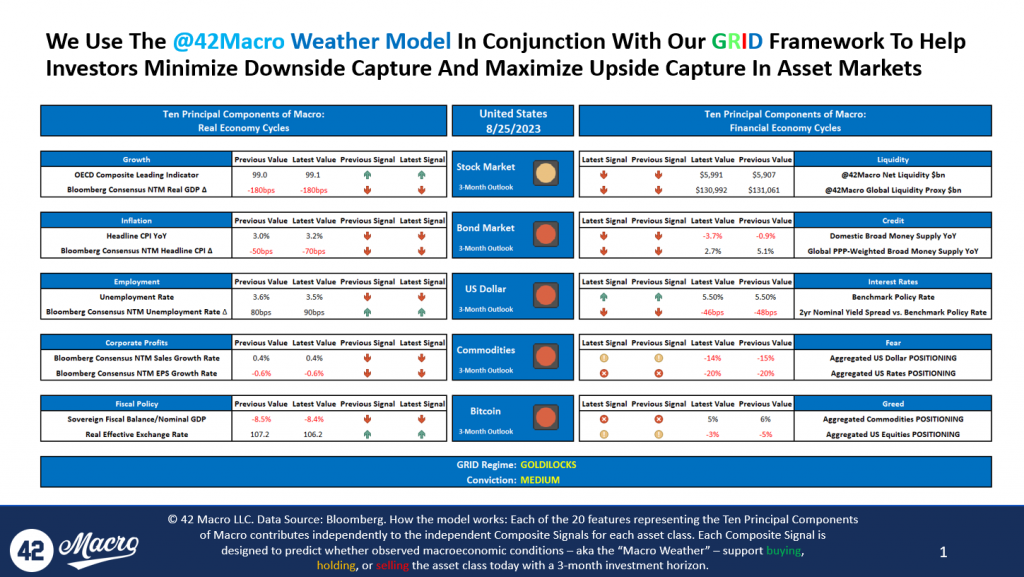
Our 42 Macro Weather Model projects the three-month outlook for stocks, bonds, the dollar, commodities, and Bitcoin by analyzing specific indicators within the following ten components of macro:
- Growth
- Inflation
- Unemployment rate
- Corporate profits
- Fiscal Policy
- Global Liquidity
- Credit
- Interest Rates
- Fear
- Greed
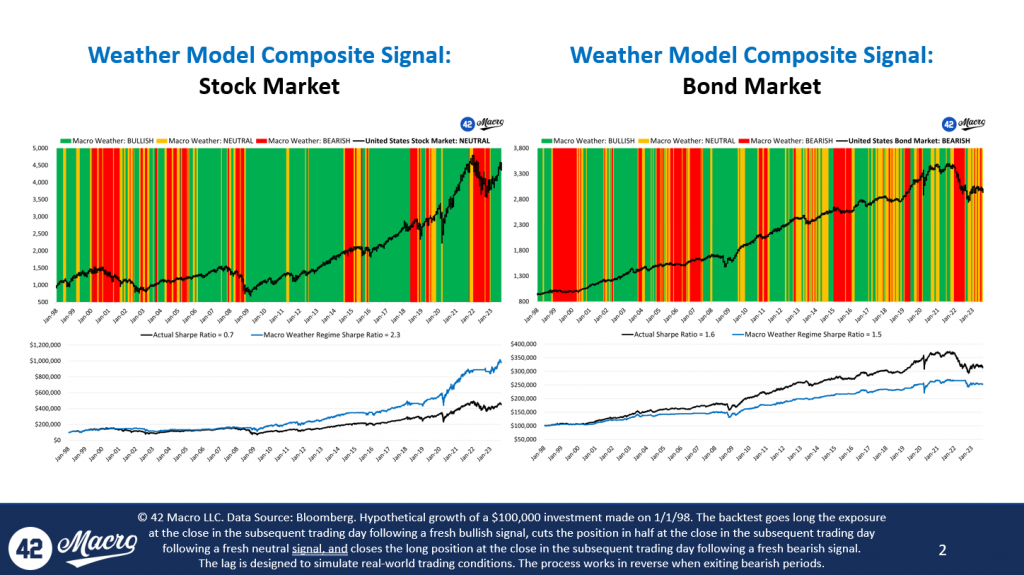
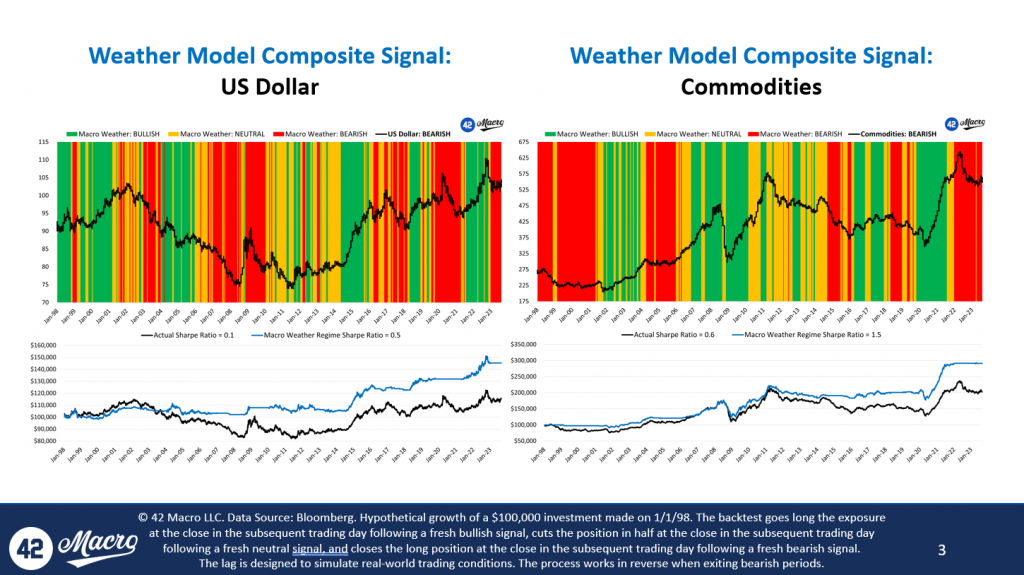
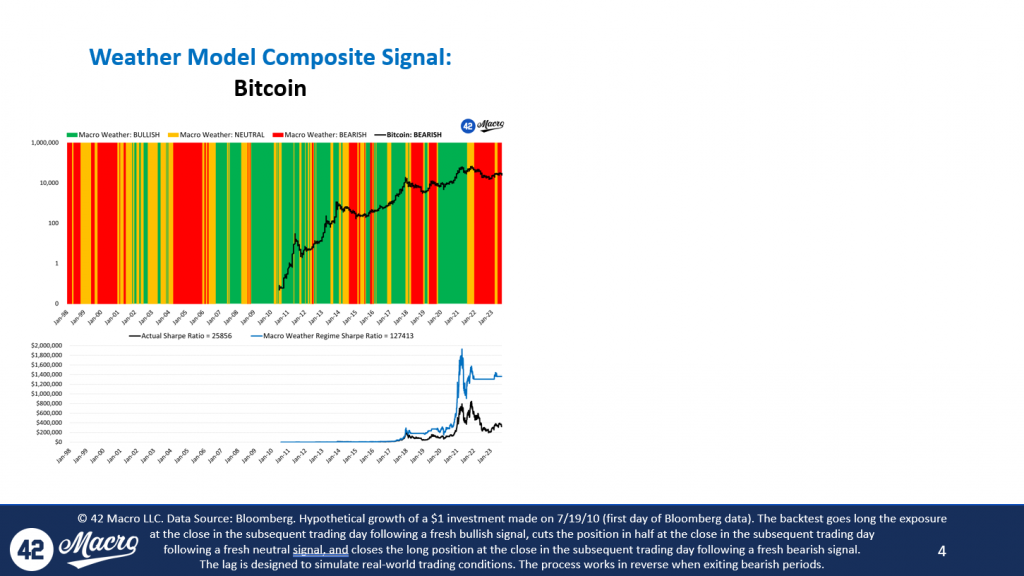
Currently, the Weather Model indicates a neutral three-month outlook for stocks and bonds and a bearish three-month outlook for the dollar, commodities, and Bitcoin.
Our daily systematic scoring of key fundamental and technical indicators suggest this is not a great time to be taking a lot of risk in financial markets.
2. The August Jobs Report Will Likely Perpetuate Additional Right-Tail Risk In The US Equity Market Specifically
In the August jobs report:
- Private Sector Employment accelerated to 2.3% on a three-month annualized basis.
- Private Sector Average Hourly Earnings decelerated to 3.9% on a three-month annualized basis, right around the pre-covid trend.
- Private Sector Average Weekly Hours accelerated to 0.0%, the highest reading since March.
- Private Sector Labor Income, the broadest measure of wages and salaries the labor market produces, accelerated to 6.2% on a three-month annualized basis.
In its current “Goldilocks” state, the labor market is too hot to spark further tightening from the Fed but too cold to raise recession fears.
We can persist in this state for several months, which may create additional right-tail risk in the equity market as underperforming professional investors stare down career risk heading into yearend.
3. Near Record Cash on Household Balance Sheets Is Supporting The Resiliency of The US Economy
Our Cash on Household Balance Sheets calculation tracks the Federal Reserve, flow of funds, checkable deposits, and money market fund exposure for both the household and corporate sectors.
The household sector maintains 3% of total assets, or $4.5 trillion, in checkable deposits – approximately $3 trillion more than its pre-COVID values.
The corporate sector checkable deposits also sit around 3% of total assets as well.
Including money market fund exposure, we are currently witnessing the highest levels of cash on the private sector balance sheet as a % of total assets since the 1950s.
That’s a wrap!
If you found this blog post helpful:
- Go to www.42macro.com to unlock actionable, hedge-fund-caliber investment insights.
- RT this thread and follow @42Macro and @42MacroWeather.
- Have a great day!
Will Bitcoin Crash Before The Halving?
Darius recently sat down with Anthony Pompliano to discuss global liquidity, bitcoin, the Fed, and more.
If you missed the interview, here are three takeaways from the conversation that have significant implications for your portfolio:
1. The Years Leading Up to Bitcoin Halvings Are Extremely Volatile.
When we analyzed the past Bitcoin halvings from November 2012, July 2016, and May 2020, we found that in the years leading up to the halving, Bitcoin tends to have three drawdowns of more than -20% on a median basis.
All drawdowns in the year leading up to halvings have a median decline of -27%.
We believe Bitcoin will be much higher in a few years, but it will likely require a rough path to reach its destination.
2. Over The Next Year, Liquidity Will Determine Bitcoin’s Path.
On a median basis, Bitcoin increases 144% in the year leading up to halvings.
These increases have closely followed global liquidity cycles; the liquidity cycle bottomed in 2012 and 2015, years leading into the halvings where Bitcoin increased 384% and 144%, respectively.
However, in 2019, when liquidity conditions were less favorable than in 2011 and 2015, Bitcoin failed to see a similar price increase.
The increase that year was only 20%, and the drawdowns were more significant than in the previous pre-halving years.
The amount of liquidity in asset markets will decide Bitcoin’s path over the next year.
3. We Believe The Fed Will Be Forced to Increase Their Inflation Target From 2% to 3%
The change will likely come in two phases:
- First, the market will become comfortable with inflation settling above 2%. This is likely a 2024-25 phenomenon.
- Then, when the unemployment rate is high enough, and with enough political pressure, the Fed will officially increase its target to 3%, ultimately paving the way for it to resume QE and lower interest rates. This is likely a 2025-26 phenomenon.
That’s a wrap!
If you found this blog post helpful:
- Go to www.42macro.com to unlock actionable, hedge-fund-caliber investment insights.
- RT this thread and follow @42Macro and @42MacroWeather.
- Have a great day!
All Things Macro
Darius recently sat down with Nick Halaris to discuss proper risk management, the labor market, inflation, asset markets, and much more.
If you missed the interview, here are three takeaways from the conversation that have significant implications for your portfolio:
1. Investors Are Doing A Great Disservice To Themselves By Not Being Bayesian
At 42 Macro, we use three core tenants to form our systematic macro risk management process:
- Regime Segmentation: We identify which investable regime the economy is in, the probability of that regime persisting, and how long it is likely to persist.
- Bayesian Inference: We systematically update the probability of relevant economic scenarios as new information becomes available to the market.
- Risk Management Tools: We use sophisticated quantitative tools like our Volatility Adjusted Momentum Signal (VAMS) and Global Macro Risk Matrix to predict when the price momentum of a particular security or overall market regime (risk on vs. risk off) is likely to change.
We urge our readers to infuse proper risk management in their investment strategies. We welcome you to use our tools if you want to gain a systematic edge in the market: https://42macro.com/sampleresearch.
2. Labor Hoarding Has Contributed To The Resilience Of The US Economy
The most recent US Total Labor Force SA reading was 167 million people – a value below its trendline since 2009.
Conversely, Gross Domestic Income recovered its trendline approximately 18 months ago and remains above it.
The discrepancy in strength between the two indicators suggests there is a large amount of cash in the economy that can be used to demand goods and services but insufficient labor to supply those goods and services.
3. History Tells Us The Fed Must Break The Economy to Achieve Its Price Stability Mandate
We analyzed every recession since 1969 and found that, on a median basis, core PCE inflation is almost always flat-to-up in the year leading up to a recession.
Historically, inflation does not break down without a recession.
Both this study and our HOPE+I framework confirm that inflation is a lagging indicator, and we believe it will again fail to fall below the Fed’s 2% target without a recession.
That’s a wrap!
If you found this blog post helpful:
- Go to www.42macro.com to unlock actionable, hedge-fund-caliber investment insights.
- RT this thread and follow @42Macro and @42MacroWeather.
- Have a great day!
Evidence Of A Potential Wage-Price Spiral
The ~150,000 member United Auto Workers (UAW) union has declared “war” on Detroit’s big three auto makers GM $GM, Ford $F, and Stellantis $STLAM IM, threatening a strike by September 15 if the companies fail to acquiesce to demands that include a +46% wage increase and a decline in the work week to 32 hours. If a new collective bargaining agreement cannot be achieved by the deadline, the strike will be joined by Unifor — Canada’s largest labor union with ~315,000 total workers and ~18,000 auto workers.
Stories like this are supportive of our view that the narrative around inflation is likely to shift from “immaculate disinflation” to “sticky inflation” within 3-6 months. We have been keen to call out the elevated probability of a soft landing in the US economy. While a soft landing is not our modal outcome, we believe it is a scenario worth educating you on because a soft landing in the economy is highly likely to result in a soft landing in inflation relative to the Fed’s 2% target — which Powell went out of his way to quadruple down on last Friday at Jackson Hole.
No firm on global Wall Street has had a more accurate view on the resiliency of the US economy than @42Macro has for the past year and, as a result, a better call on bonds. We still see more fixed income volatility in the months ahead because we believe the consensus narrative surrounding inflation is likely to deteriorate before the recession hits.
Odds Are You Suck at Predicting, So Stop
Odds Are You Suck at Predicting, So Stop
Now that we have your attention, let’s spend the next 90 seconds together helping you become a better investor:
- In August 2019, what did you expect to occur in the economy and financial markets in 2020? You would be lying if you said risk assets would suffer their deepest crash since 2008 amid a global pandemic, only to recover sharply because of record fiscal and monetary stimulus.
- In August of 2020, what did you expect to occur in the economy and financial markets in 2021? You would be lying if you said the US economy and risk assets would BOOM due to the combination of vaccine proliferation and record fiscal and monetary stimulus.
- In August of 2021, what did you expect to occur in the economy and financial markets in 2022? You would be lying if you said the Fed would tighten monetary policy at the fastest pace in 40 years amid a 40-year high in inflation.
- In August of 2022, what did you expect to occur in the economy and financial markets in 2023? You would be lying if you said both the US economy and the stock market would prove to be far more resilient than the bond market.
Stop trying to predict everything and join the systematic investing revolution benefitting thousands of 42 Macro clients worldwide. We do as much fundamental research as any firm on global Wall Street regarding what is likely to happen in financial markets, but we do not let those views influence our investment decisions.
The only information that impacts our portfolio recommendations is A) what is actually happening in the economy (not to be confused with what we expect to happen); and B) how what is actually happening has historically influenced asset market performance. The alternative to our systematic, trend-following approach is blowing up your or your clients’ account(s) thinking you can top and bottom tick asset markets with any consistency.
Our Macro Weather Model is the cutting-edge quantitative tool that 42 Macro clients rely upon to nowcast A and backtest B, in real-time, on a rolling basis:


CLICK HERE to download our full Macro Weather Model slide deck for today, August 25th, 2023.
CLICK HERE to see our Macro Weather Model in action across our various research products.
For those of you that now understand the value of adding a Bayesian research and risk management overlay to your investment process, we look forward to helping you improve both your investment performance and investing acumen.For the rest of you, best of luck with your 2024 predictions! We genuinely hope they aren’t as off target as your Aug-19, Aug-20, Aug-21, and Aug-22 predictions likely were about 2020, 2021, 2022, and 2023. Have a great day!
What is Making the U.S. Economy so Resilient?
This week, Darius sat down with Maggie Lake from Real Vision to discuss the resiliency of the US economy, the housing market, and much more.
If you missed the interview, we have you covered. Here are three takeaways from the conversation that have significant implications for your portfolio:
1. The Resiliency of the US Economy Will Likely Continue
Our research shows the US economy has nowcast itself into “GOLDILOCKS” for the past five months. GOLDILOCKS is a regime marked by growth trending higher and inflation trending lower.
The strength of the economy will likely continue because:
- Goods demand is increasing — real goods PCE increased 5.4% on a three-month annualized basis in the most recent month.
- Corporations have been reducing inventories for the past five quarters, reducing 72 basis points off of GDP per quarter, on average. This, paired with increasing demand, could lead to inventory restocking the next few quarters.
2. New Home Sales Are Surging Because The Existing Home Sales Market Has Been Starved of Supply
Today, homeowners are unwilling to sell their homes and trade their ~3.5% mortgage (the effective mortgage rate nationally) for the current market rate of ~7%.
This supply shortage is causing a spike in new home builds:
- Building Permits are growing at 7% on a three-month annualized basis.
- Housing Starts are growing 31% on a three-month annualized rate of change basis.
- New Home Sales are growing at 21% on a three-month annualized basis.
3. “Bidenomics” Is Also Contributing to Our “Resilient US Economy” Theme
The US economy is experiencing a record non-war, non-recession budget deficit under the current administration.
Last year, the deficit was -3.7% of GDP.
Today, it is -8.4%.
That 470 basis point difference equates to approximately $1.3 trillion of incremental fiscal stimulus supplied to the US economy, further contributing to its resiliency.
That’s a wrap!
If you found this blog post helpful:
- Go to www.42macro.com to unlock actionable, hedge-fund caliber investment insights.
- RT this thread and follow @42Macro and @42MacroWeather.
- Have a great day!
Even Higher For Much Longer
Global bond yields hit their highest level since 2008 as investors were forced by the data we have been highlighting to reprice economic resiliency in places like the US and Japan, as well as sticky inflation in places like the Eurozone and UK.
Last week’s Industrial Production (+210bps to a 2mo high 3mo SAAR of -0.9% in July), Capacity Utilization (+70bps to a 2mo high of 79.3% in July), Building Permits (+590bps to a 3mo high 3mo SAAR of 7.1% in July), Housing Starts (+2,560bps to a 2mo high 3mo SAAR of 30.9% in July), and NY Fed Services Activity Survey (+0.6pts to 0.6 in August; highest since Sep-22) were each marginally confirming of our “resilient US economy” theme.
Market participants are increasingly accepting the “higher for longer” guidance we have seen from a handful major central banks — most notably the Federal Reserve.
Floor policy rate expectations (min value on OIS curve out 2yrs) for the ECB, Fed, and BOE have climbed +3bps, +39bps, and +37bps MoM, respectively.
That’s dragged 10yr Nominal German Bund, US Treasury, and UK Gilt Yields up +18bps, +48bps, +37bps, respectively, over that same duration.
The 10yr Nominal JGB Yield — which is effectively managed by the BOJ — is even up +22bps MoM.
Turbulent Markets Ahead?
Last week, Darius sat down with Paul Barron to discuss global bond markets, #inflation, #bitcoin, and more.
If you missed the interview, we have you covered. Here are three takeaways from the conversation that every investor needs to see:
1. Volatility Has Returned to Global Bond Markets
Over the past month, there has been a striking shift in bond market volatility:
- The US 10-year yields have increased by 48 basis points
- The UK Gilt 10-year yields have increased by 43 basis points
- The German Bunds have increased by 22 basis points
Incremental confirmation of the economic resiliency in the US and Japan and the resiliency of inflation in the Eurozone and the UK have been the driving factors of this uptick in bond market volatility.
2. The Resiliency of The US Economy Will Likely Cause Inflation to Persist
Since last fall, inflation has declined in an “immaculate” way; historically, inflation has only broken down two to three quarters after recessions begin.
But the US economy is not in recession – in fact, it is booming in some respects. The latest estimate for Q3 GDP per the Atlanta Fed’s GDPNow model is a whopping 5.8%.
The strong US economy will likely cause inflation to stabilize at levels higher than the Fed’s price stability mandate.
Within the next 3-6 months, we expect the narrative to pivot from ‘immaculate disinflation’ to ‘sticky inflation.’
3. The Path to Bitcoin’s Next Bull Market Will Likely Remain Volatile
Historically, Bitcoin experiences several 20 to 40% corrections in the years leading up to halvings. We experienced an 18% correction over the past ~month – something we have warned our audience about since April.
We foresee two major tailwinds for Bitcoin in the next year:
- The Bitcoin ETF will eventually get approved, bringing institutional interest with it.
- After the recession begins, which will likely occur in the first half of next year, we anticipate a surge in global liquidity.
We believe these two tailwinds will push Bitcoin north of $100,000 by December 2024, but the path to get there will continue to be rocky and likely back-end loaded.
That’s a wrap!
If you found this blog post helpful:
- Go to www.42macro.com to unlock actionable, hedge-fund caliber investment insights.
- RT this thread and follow @42Macro and @42MacroWeather.
- Have a great day!