We value your privacy
We use cookies to enhance your browsing experience and analyze our traffic. Please choose your preferences.

Introduction to the 42 Macro Process

At 42 Macro, we believe that proactively aligning with the prevailing macro regime is the most reliable way to manage drawdowns, capture upside, and compound returns sustainably over time.

Macro helps explain why equities fall during monetary tightening or why gold rallies during fiscal dominance. Ignoring macro is not just an oversight—it’s a liability.

Macro overlays, like our systems here at 42 Macro, act as both a compass and a shield, guiding allocation and protecting portfolios from avoidable shocks.

CHAPTER 1

Key Macro Cycles

At 42 Macro, our view centers on the belief there are six key macro cycles that determine momentum and dispersion within and across asset markets:

  • Growth
  • Inflation
  • Monetary Policy
  • Fiscal Policy
  • Positioning
  • Liquidity

Together, these key cycles explain why assets trend, leadership rotates, and why dispersion emerges across geographies, asset classes, and sectors.

Growth

The change in the level of economic activity as measured by publicly available and/or widely followed periodic indicators like GDP, Industrial Production, Consumer Spending, PMIs, etc.

Inflation

Inflation refers to the change in the level of prices as measured by publicly available and/or widely followed periodic indicators like the Consumer Price Index, Producer Price Index, Personal Consumption Expenditures Price Index, etc. Our process anchors on Headline CPI because that statistic tends to have the most predictive value with respect to forecasting inflections and/or persistence in the momentum of key financial market indicators like interest rates.

Monetary Policy

Monetary policy involves actions by a country’s central bank to manage the money supply to promote economic growth and stability. Key strategies include adjusting interest rates and bank reserve requirements, aiming for high employment while controlling inflation.

Fiscal Policy

The use of government spending and tax policies to influence economic conditions, especially macroeconomic conditions, such as the aggregate demand for goods and services, employment, inflation, and economic growth.

Positioning

Positioning reflects how investors have responded to the macro environment through capital allocation, leverage, and risk exposure. Even when macro fundamentals are supportive, crowded positioning can make markets vulnerable to sharp reversals and volatile trading. Conversely, weak fundamentals can produce powerful rallies when positioning is light and consensus is pessimistic.

Liquidity

Liquidity refers to how easy or difficult it is for people, businesses, and investors to borrow money. Declining interest rates, easing lending standards, and rising prices of loan collateral like homes or government bonds all contribute to improving liquidity conditions within an economy. Higher liquidity tends to lead to higher economic growth.

CHAPTER 2

Macro Regimes

Financial markets do not operate in a continuous, uniform state. Instead, they cycle through a limited number of recurring conditions driven by changes in the momentum of growth and inflation. These conditions determine whether markets are broadly supportive of risk-taking or defensive positioning.

Correctly identifying the prevailing regime — and recognizing when it is changing — is central to effective risk management. Factor and volatility dynamics all vary meaningfully by regime.

Defining GRID Regimes

We organize macro regimes at 42 Macro using our GRID framework, which consists of four states.

Goldilocks

Growth accelerating, inflation decelerating.

Reflation

Growth accelerating, inflation accelerating.

Inflation

Growth decelerating, inflation accelerating.

Deflation

Growth decelerating, inflation decelerating.

Bottom-Up vs. Top-DownRegimes

42 Macro evaluates regimes from two complementary perspectives.

Bottom-Up Macro Regimes

Bottom-Up Macro Regimes are the characterization of an economy according to the trending rates of change of growth and inflation.

For the purposes of our GRID Regime process, we define the trending rates of change as the trailing 3-month level change of Real GDP YoY and the trailing 3-month level change of Headline CPI YoY.

Top-Down Market Regime

The GRID Regime with the highest Share of Confirming Markets is said to be the Top-Down Market Regime. The Top-Down Market Regime is very important to our investment process because it dictates the asset allocation (e.g., how many stocks vs. how many bonds) and portfolio construction (e.g., what type of stocks and what type of bonds) recommendations we communicate to clients via KISS and “Dr. Mo” — the two systematic, institutional-grade risk management overlays that dictate all our positioning.

Using both perspectives together allows investors to balance economic insight with market reality.

RORO Phase Transitions

Transitions between risk-on and risk-off regimes — known as RORO (Risk-On / Risk-Off) Phase Transitions — are the most important moments for managing portfolio risk. Empirically, these transitions have occurred only 2–3 times per year.

This means investors do not need to trade frequently to succeed. Instead, disciplined performance comes from adjusting exposure when regimes change and remaining patient when they do not.

Historical RORO Phase Transition Data
CHAPTER 3

Market Regime Confirmation

Understanding macro regimes is only useful if investors can determine which regime is dominant in real time. Economic data is released with lags, revised frequently, and often fails to capture turning points until after markets have already moved.

We emphasize market regime confirmation to bridge this gap. Confirmation helps investors avoid acting too early on incomplete information or too late after markets have already repriced. It provides a systematic way to assess whether observed market behavior is consistent with a risk-on or risk-off environment.

The Global Macro Risk Matrix

42 Macro performs market regime confirmation using the Global Macro Risk Matrix, a daily Bayesian inference process that evaluates dozens of macro market indicators spanning equities, fixed income, currencies, and commodities.

Market Regime Confirmation

Market regime confirmation transforms macro analysis into actionable context. By validating regime signals across markets and assessing the degree of fear or complacency, investors can manage exposure with greater confidence.

VAMS Signals on Our 42 Macro Client Dashboard

Each indicator is assessed using the Volatility-Adjusted Momentum Signal (VAMS) framework. Indicators that are behaving in a manner consistent with a given GRID Regime contribute to that regime’s score. The regime with the highest share of confirming markets is identified as the Top-Down Market Regime.

CHAPTER 4

The Four Horsemen of Economic Risk

Why Economic Risk Is Structural

A set of macroeconomic indicators that we employ to quantify the secular drivers of asset markets: Demographics, Leverage, Politics, and Balance of Payments.

Each horseman captures a distinct dimension of economic sustainability and market vulnerability. Together, they form a consistent framework for comparing economies and understanding why similar cyclical conditions can produce very different market outcomes across geographies.

The Four Horsemen of Economic Risk

  • Demographics measure an economy’s nominal growth potential through labor force dynamics.
  • Leverage measures where an economy sits in the credit cycle and the risk of broad-based deleveraging.
  • Politics measures the risk of populist fiscal policy and its implications for asset markets.
  • Balance of Payments measures external funding dynamics that tend to influence currency strength and relative valuations for equity and fixed income markets.

The Four Horsemen of Economic Risk allows us to readily identify which economies are set up to outperform and underperform on a relative basis across a variety of economic and financial market indicators.

CHAPTER 5

The Four Horsemen of Market Risk

Why Market Risk Signals Lead

While economic data is backward-looking, markets are forward-looking. Changes in investor behavior, risk tolerance, and capital allocation often appear in market internals before they show up in economic statistics or consensus narratives.

We monitor these internal dynamics through the Four Horsemen of Market Risk.

Defining The Four Horsemen of Market Risk

The Four Horsemen of Market Risk are relative performance ratios that capture shifts in risk appetite:

  • High Beta/Low Beta Ratio
  • Cyclicals/Defensives Ratio
  • Small Cap/Mega Cap Ratio
  • Value/Growth Ratio

Each ratio reflects how investors are reallocating capital in response to perceived changes in the macro environment.

Why These Ratios Matter

When investors grow more confident, capital tends to rotate toward higher beta, more cyclical, and more growth-sensitive exposures. When confidence deteriorates, capital flows shift defensively toward lower beta, less cyclical, and value-oriented exposures. Because these reallocations happen continuously, these ratios often break down or break out before broad market indices do.

As a result, the Four Horsemen of Market Risk are particularly effective at identifying pending RORO phase transitions in the market regime.

Putting It Together

Market risk indicators translate investor behavior into actionable signals. By monitoring how capital is rotating within markets, investors gain early insight into whether risk-on or risk-off conditions are emerging—well before they become obvious in macro data or headlines.

Ratios

CHAPTER 6

Liquidity & Volatility

Liquidity & volatility determine whether macro fundamentals express themselves smoothly or violently in asset prices. Understanding how liquidity and volatility are evolving helps investors distinguish between stable environments that support risk-taking and fragile environments that demand caution.

WHY LIQUIDITY & VOLATILITY MATTER

Liquidity determines how macroeconomic conditions translate into asset prices. While growth and inflation describe the economic backdrop, liquidity governs whether markets can absorb shocks or whether small disturbances become large price moves. Liquidity is a core input into our macro risk management process because it directly influences market stability. Periods of abundant liquidity tend to support sustained uptrends and higher risk tolerance, while periods of declining liquidity increase the probability of regime transitions, elevated volatility, and drawdowns.

Volatility is the observable manifestation of changing liquidity conditions. Rising volatility often signals that liquidity is deteriorating, investors’ risk appetite and/or balance sheet capacity are shrinking, and markets are becoming more fragile.

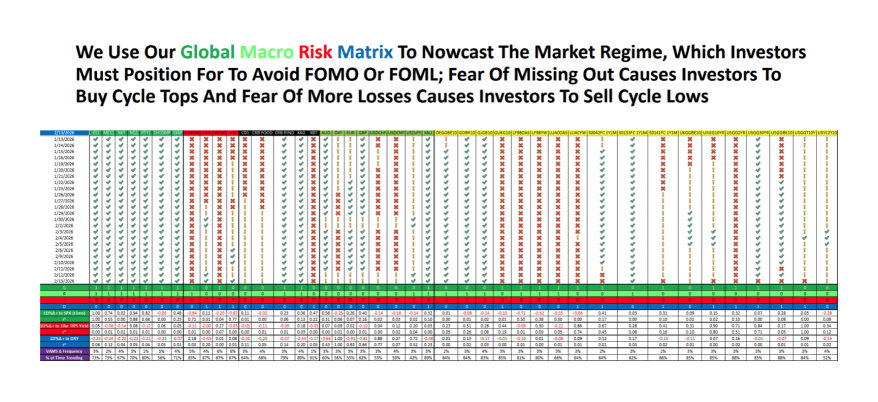
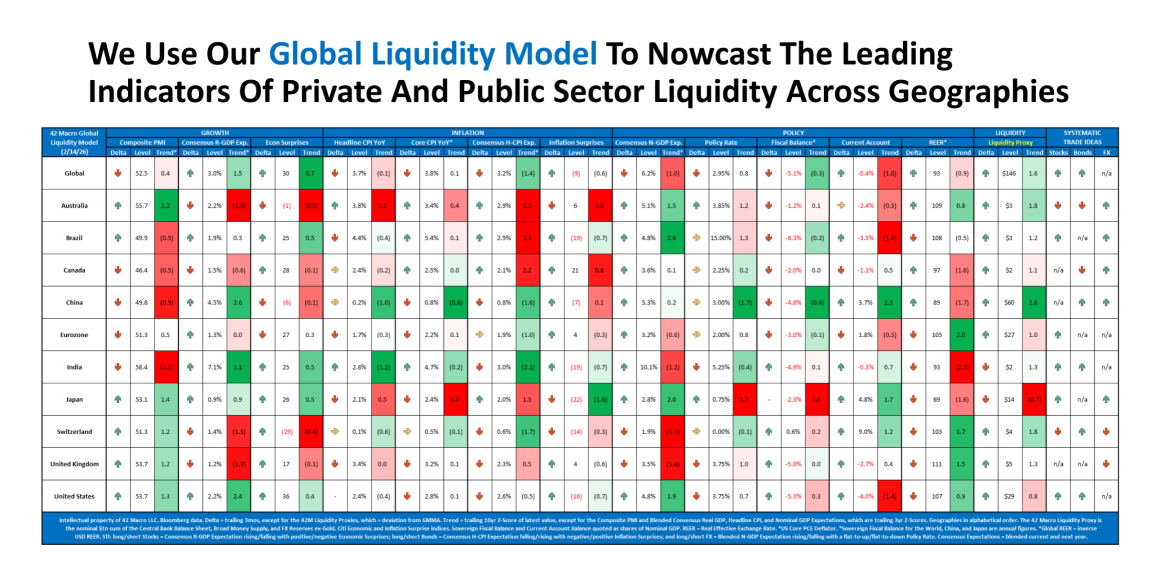
Measuring Liquidity Trends

42 Macro uses the Global Liquidity Model, which is the primary tool we use to nowcast the key cycles that are most predictive of global liquidity trends and forecast their likely influence upon global liquidity and asset markets.

We also use our Global Liquidity Proxy which measures global liquidity by aggregating the U.S. dollar value of major economy central bank balance sheets, broad money supply, and fiat foreign exchange reserves.

Defining Volatility

Volatility measures the magnitude of price fluctuations in financial markets, reflecting both realized price movement and investor expectations of future price movement.

Rising volatility often coincides with declining liquidity, tighter financial conditions, and reduced risk appetite. Conversely, low and stable volatility typically reflects ample liquidity and strong risk tolerance. In our process, volatility is not viewed as an isolated signal, but as a confirmation mechanism that helps contextualize changes in liquidity and the market regime.

CHAPTER 7

Momentum, Consensus, & Crowding

Asset prices are not driven by fundamentals alone. They are also shaped by how investors respond to those fundamentals through positioning, leverage, and risk-taking behavior. As prices move, investor behavior adapts, creating feedback loops that can either reinforce existing trends or cause them to reverse.

Momentum, consensus, & crowding help explain whether a market trend is likely to persist or reverse. Strong fundamentals can fail to produce sustained returns if positioning becomes excessively crowded, while weak fundamentals can produce powerful rallies when positioning is light, sentiment is depressed, and a positive data point(s) catalyzes short covering by investors.

42 Macro's Crowding Model

Momentum

Momentum refers to the persistence of price trends over time. Assets with positive momentum tend to continue outperforming and assets with negative momentum tend to continue underperforming until a RORO phase transition in the market regime occurs.42 Macro measures momentum using the Volatility-Adjusted Momentum Signal (VAMS). By adjusting momentum for volatility, VAMS helps identify trends that are strengthening under stable conditions versus trends that are deteriorating as volatility rises. The volatility adjustment is valuable because it tends to be a leading indicator for breakouts or breakdowns in medium-term price momentum.

Consensus & Crowding

Consensus reflects the degree to which investors broadly agree on a particular market outcome. Crowding occurs when that agreement translates into concentrated positioning, leaving markets vulnerable to sharp reversals if expectations change.42 Macro measures these dynamics using our Crowding Model, Positioning Model & Dispersion Model, which track extremes in fund flows, survey data, and cross-asset performance. These measures help identify when bullish or bearish positioning has become stretched relative to historical norms, thus leaving markets vulnerable to sharp reversals.

CHAPTER 8

Portfolio Construction & Execution

Understanding macro regimes, liquidity, momentum, and risk confirmation is only valuable if it leads to consistent, disciplined portfolio decisions.

Without a systematic approach to implementation, even the best macro framework can be undermined by emotion, timing errors, or overtrading.

KISS Model Portfolio Backtest

Implementation

To implement this approach consistently, 42 Macro relies on systematic tools that remove discretion from day-to-day decision-making.

KISS

The KISS (Keep It Simple & Systematic) Model Portfolio applies market regime awareness for volatility targeting and momentum awareness for dynamic positioning sizing to a simplified asset mix designed to maximize upside capture during risk-on environments and minimize downside capture during risk-off regimes. Position changes occur only when underlying signals change, reinforcing patience and discipline.

Dr. Mo

For institutional investors, Dr. Mo provides a discretionary risk management overlay that prescribes long–short exposure and position sizing signals based on market regime alignment and momentum confirmation. This framework helps investors avoid common behavioral pitfalls such as the action bias, overconfidence, hyperbolic discounting, and the illusion of validity.

WHY DISCIPLINE MATTERS MORE THAN PRECISION

The most common investment mistakes are Type 1 and Type 2 errors. A Type 1 error is a “false positive,” where a decision to buy (or sell) is not rewarded by subsequent appreciation (or depreciation) of the asset.

Conversely, a Type 2 error is a “false negative,” a decision to not buy (or not sell) is punished by subsequent appreciation (or depreciation) of the asset. Type 1 errors are the result of investors attempting to remain on the right side of developing market risk by positioning according to evolving market dynamics—e.g., longing “expensive” stocks that have positive momentum. Type 2 errors are the result of investors attempting to predict a reversal of developing market risk by taking the other side of evolving market dynamics—such as shorting “expensive” stocks that have positive momentum.

Type 1 & Type 2 errors

TYPE 1 & TYPE 2ERRORS CONTINUED

Type 1 errors result from markets that fail to trend and, because markets trend most of the time (~75% for the S&P 500 and ~90% for Bitcoin), Type 1 errors tend to accumulate relatively small losses. Type 2 errors result from markets that fail to reverse course and tend to accumulate much more hazardous large losses. Type 2 errors occur when investors erroneously think they are smarter than the market.

In short, Type 1 errors protect investors from experiencing FOMO—the fear of missing out, which causes investors to buy cycle tops—and FOML—the fear of more losses, which causes investors to sell cycle lows. Conversely, Type 2 errors inevitably result in FOMO and FOML.

A disciplined process that adapts as conditions evolve allows investors to participate in long-term upside while mitigating downside risk. The combination of the two allows the net asset value of investors’ portfolios to grow faster because the exponential growth from compounding returns builds wealth faster with greater quantities than it does with smaller quantities.

By design, the 42 Macro framework accepts uncertainty and focuses on responding systematically to observable changes in the market regime, momentum, and liquidity rather than constantly trying to predict all these difficult-to-forecast dynamics or, worse, reacting emotionally to them.

The Three Most Important Concepts Of Investing

These following three visuals represent the core ideas that define our macro risk management process and guide how we stay on the right side of market risk.

CHAPTER 9

Behavioral Heuristics

Even the most informed investors fall prey to emotion. At inflection points, fear, greed, and recency bias often lead to poor decisions.

Market timing based on gut feel, news headlines, or macro storytelling introduces error and volatility drag.

42 Macro helps investors:

  • Avoid chasing tops (FOMO)
  • Avoid panic-selling bottoms (FOML)
  • Block out the never-ending stream of noisy news flow by limiting the frequency of investment decisions to systematic pivots

The Most Common Behavioral Heuristics That Prevent Investors — Both Professional and Retail — From Achieving Their Strategic Investment Objectives and the Systematic Solutions We Employ to Overcome Them.

Action Bias The action bias describes our tendency to favor action over inaction.

42 Macro Solution: Clear risk management signals that communicate DO NOTHING when there is no change in the signal and TAKE ACTION only when the signal changes.

Availability Heuristic The availability heuristic describes our tendency to use information that comes to mind quickly and easily when making decisions about the future.

42 Macro Solution: Daily refreshes of our Quantitative Risk Management Summary and Fundamental Research Summary.

Confirmation Bias The confirmation bias describes our underlying tendency to notice, focus on, and give greater credence to evidence that fits with our existing beliefs.

42 Macro Solution: Consistently performing research on the full distribution of probable economic outcomes in the Growth, Inflation, Monetary Policy, Fiscal Policy, Liquidity, and Positioning sections of our monthly Macro Scouting Report presentations, as well as reviewing every meaningful economic release in our daily Leadoff Morning Note — bullish or bearish.

Disposition Effect The disposition effect refers to our tendency to prematurely sell assets that have made financial gains, while holding on to assets that are losing money.

42 Macro Solution: The Top-Down and Bottom-Up Risk Management Overlays featured in our KISS Model Portfolio help investors block out countercyclical noise to maximize upside capture in bull markets and minimize downside capture in bear markets.

Hindsight Bias The hindsight bias describes our tendency to look back at an unpredictable event and think it was easily predictable.

42 Macro Solution: Consistently thorough discussions regarding the then-consensus narratives and positioning dynamics of past market cycles, as well as backtesting each of our quantitative risk management signals and econometric models on a rolling out-of-sample basis.

Hyperbolic Discounting Hyperbolic discounting is our inclination to choose immediate rewards over rewards that come later, even when these immediate rewards are smaller.

42 Macro Solution: Avoiding frameworks that [often erroneously] attempt to predict every wiggle in the stock market, such as dealer flows, CTA positioning, etc.

Illusion of Explanatory Depth The illusion of explanatory depth describes our belief that we understand more about the world than we actually do.

42 Macro Solution: The six principal component features in our Macro Weather Model (i.e., the Growth, Inflation, Monetary Policy, Fiscal Policy, Liquidity, and Positioning cycles) — which we refresh daily — remind investors that the oft-esoteric topics being discussed on Twitter/X, TikTok, and other social media platforms are not the only drivers of asset markets.

Illusion of Validity The illusion of validity is a cognitive bias that describes our tendency to be overconfident in the accuracy of our predictions.

42 Macro Solution: An institutional research process that is heavy on observation and light on predictions. When we do make predictions, they are generated by models that apply proven quantitative techniques to time series that span multiple economic and market cycles, while also quantifying and proudly publishing the error rate of each of our econometric models.

Myopic Loss Aversion Myopic loss aversion is a cognitive bias that occurs when investors take a view of their investments that is strongly focused on the short term, leading them to react too negatively to recent losses, which may be at the expense of long-term benefits.

42 Macro Solution: Clear risk management signals that communicate DO NOTHING when there is no change in the signal and TAKE ACTION only when the signal changes. Asset markets tend to appreciate over time, so our general disposition toward them is “fully invested, until a risk management signal instructs us to book gains.”

Negativity Bias The negativity bias is a cognitive bias that results in adverse events having a more significant impact on our psychological state than positive events.

42 Macro Solution: Avoiding bear porn at all costs – even to the point of ridiculing it publicly. Asset markets tend to appreciate over time, so our general disposition toward them is “fully invested, until a risk management signal instructs us to book gains.”

Optimism Bias The optimism bias refers to our tendency to overestimate our likelihood of experiencing positive events and underestimate our likelihood of experiencing negative events.

42 Macro Solution: An institutional risk management process that values being the second investor in a confirmed trade more than being first in a trade that may or may not come to fruition.

Recency Bias The recency bias refers to our tendency to better remember and recall information presented to us most recently, compared to information we encountered earlier.

42 Macro Solution: Only making marginal changes to our Fundamental Research Summary when new data builds or erodes our conviction in a theme, rather than making wholesale changes.

Sunk Cost Fallacy The sunk cost fallacy is our tendency to follow through on something that we've already invested heavily in (be it time, money, effort, emotional energy, etc.), even when giving up is clearly a better idea.

42 Macro Solution: Proven risk management signals that help investors dispassionately book small losses before they turn into big losses.

Zero Risk Bias Zero risk bias relates to our preference for absolute certainty.

42 Macro Solution: Having enough humility to avoid declarations of certainty and/or extreme confidence regarding our predictions at all costs. No reputable institutional investor speaks with certainty about the future, and you shouldn't either.